RIA PARIKH DESIGN
RIA PARIKH DESIGN
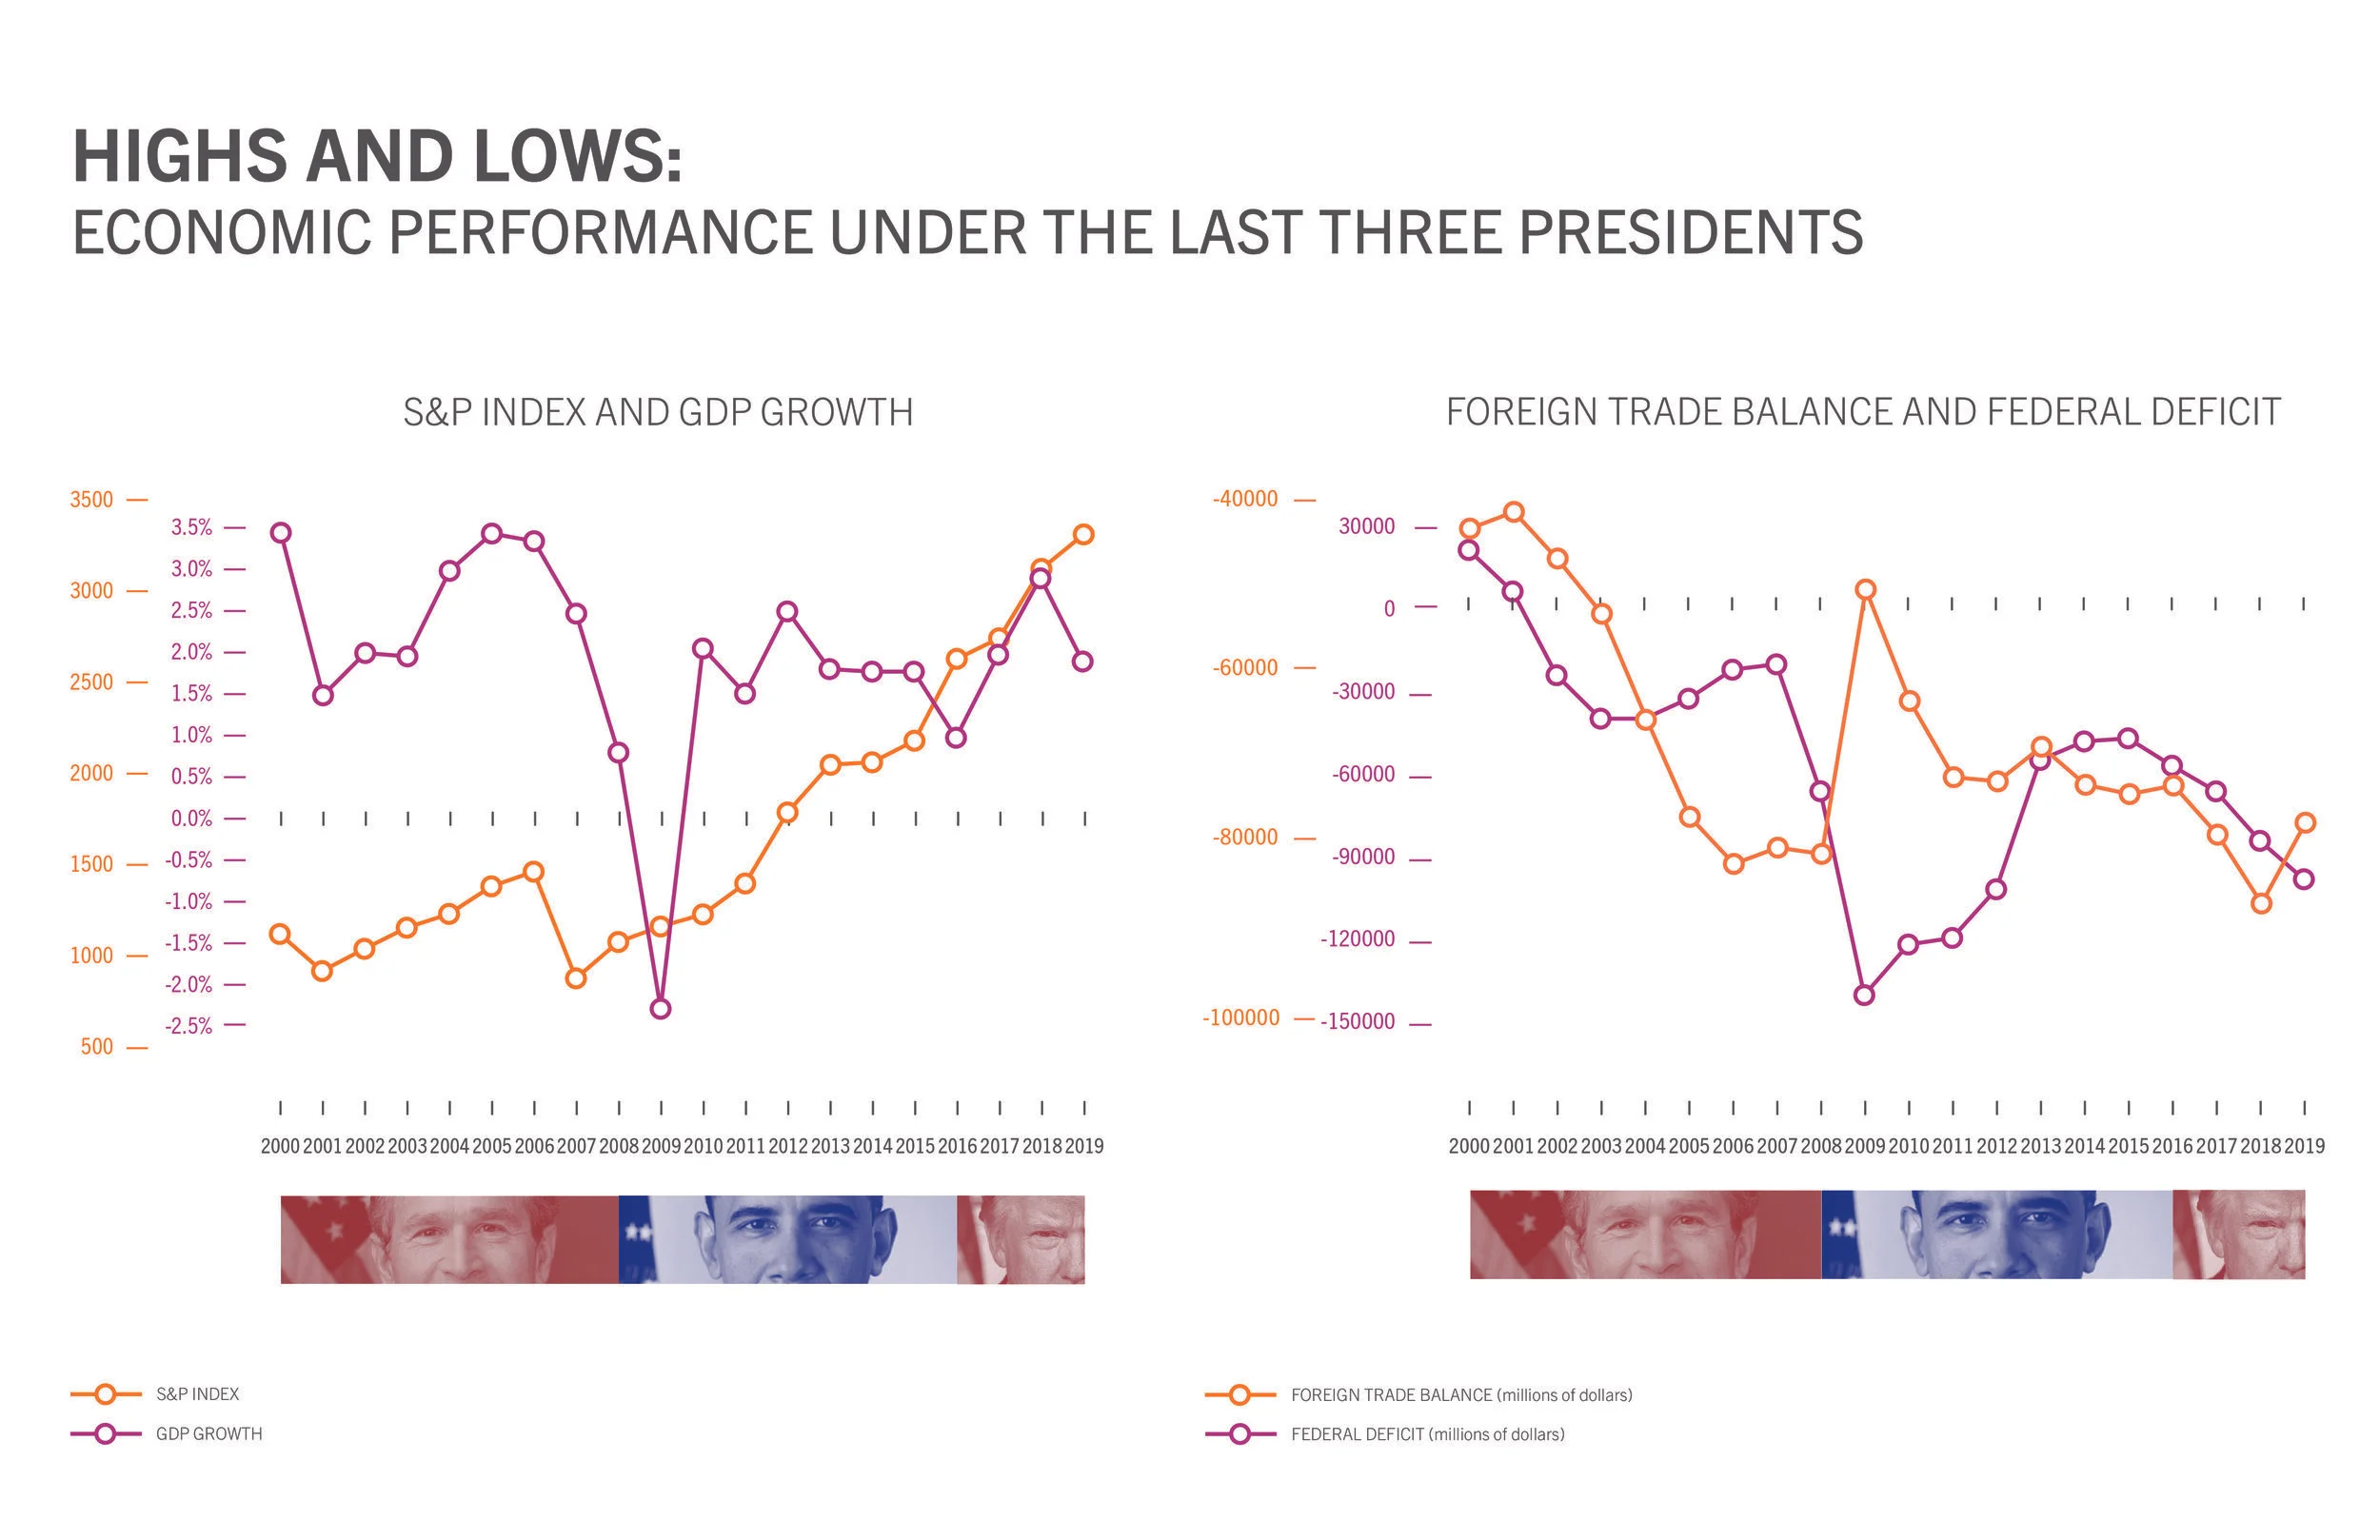
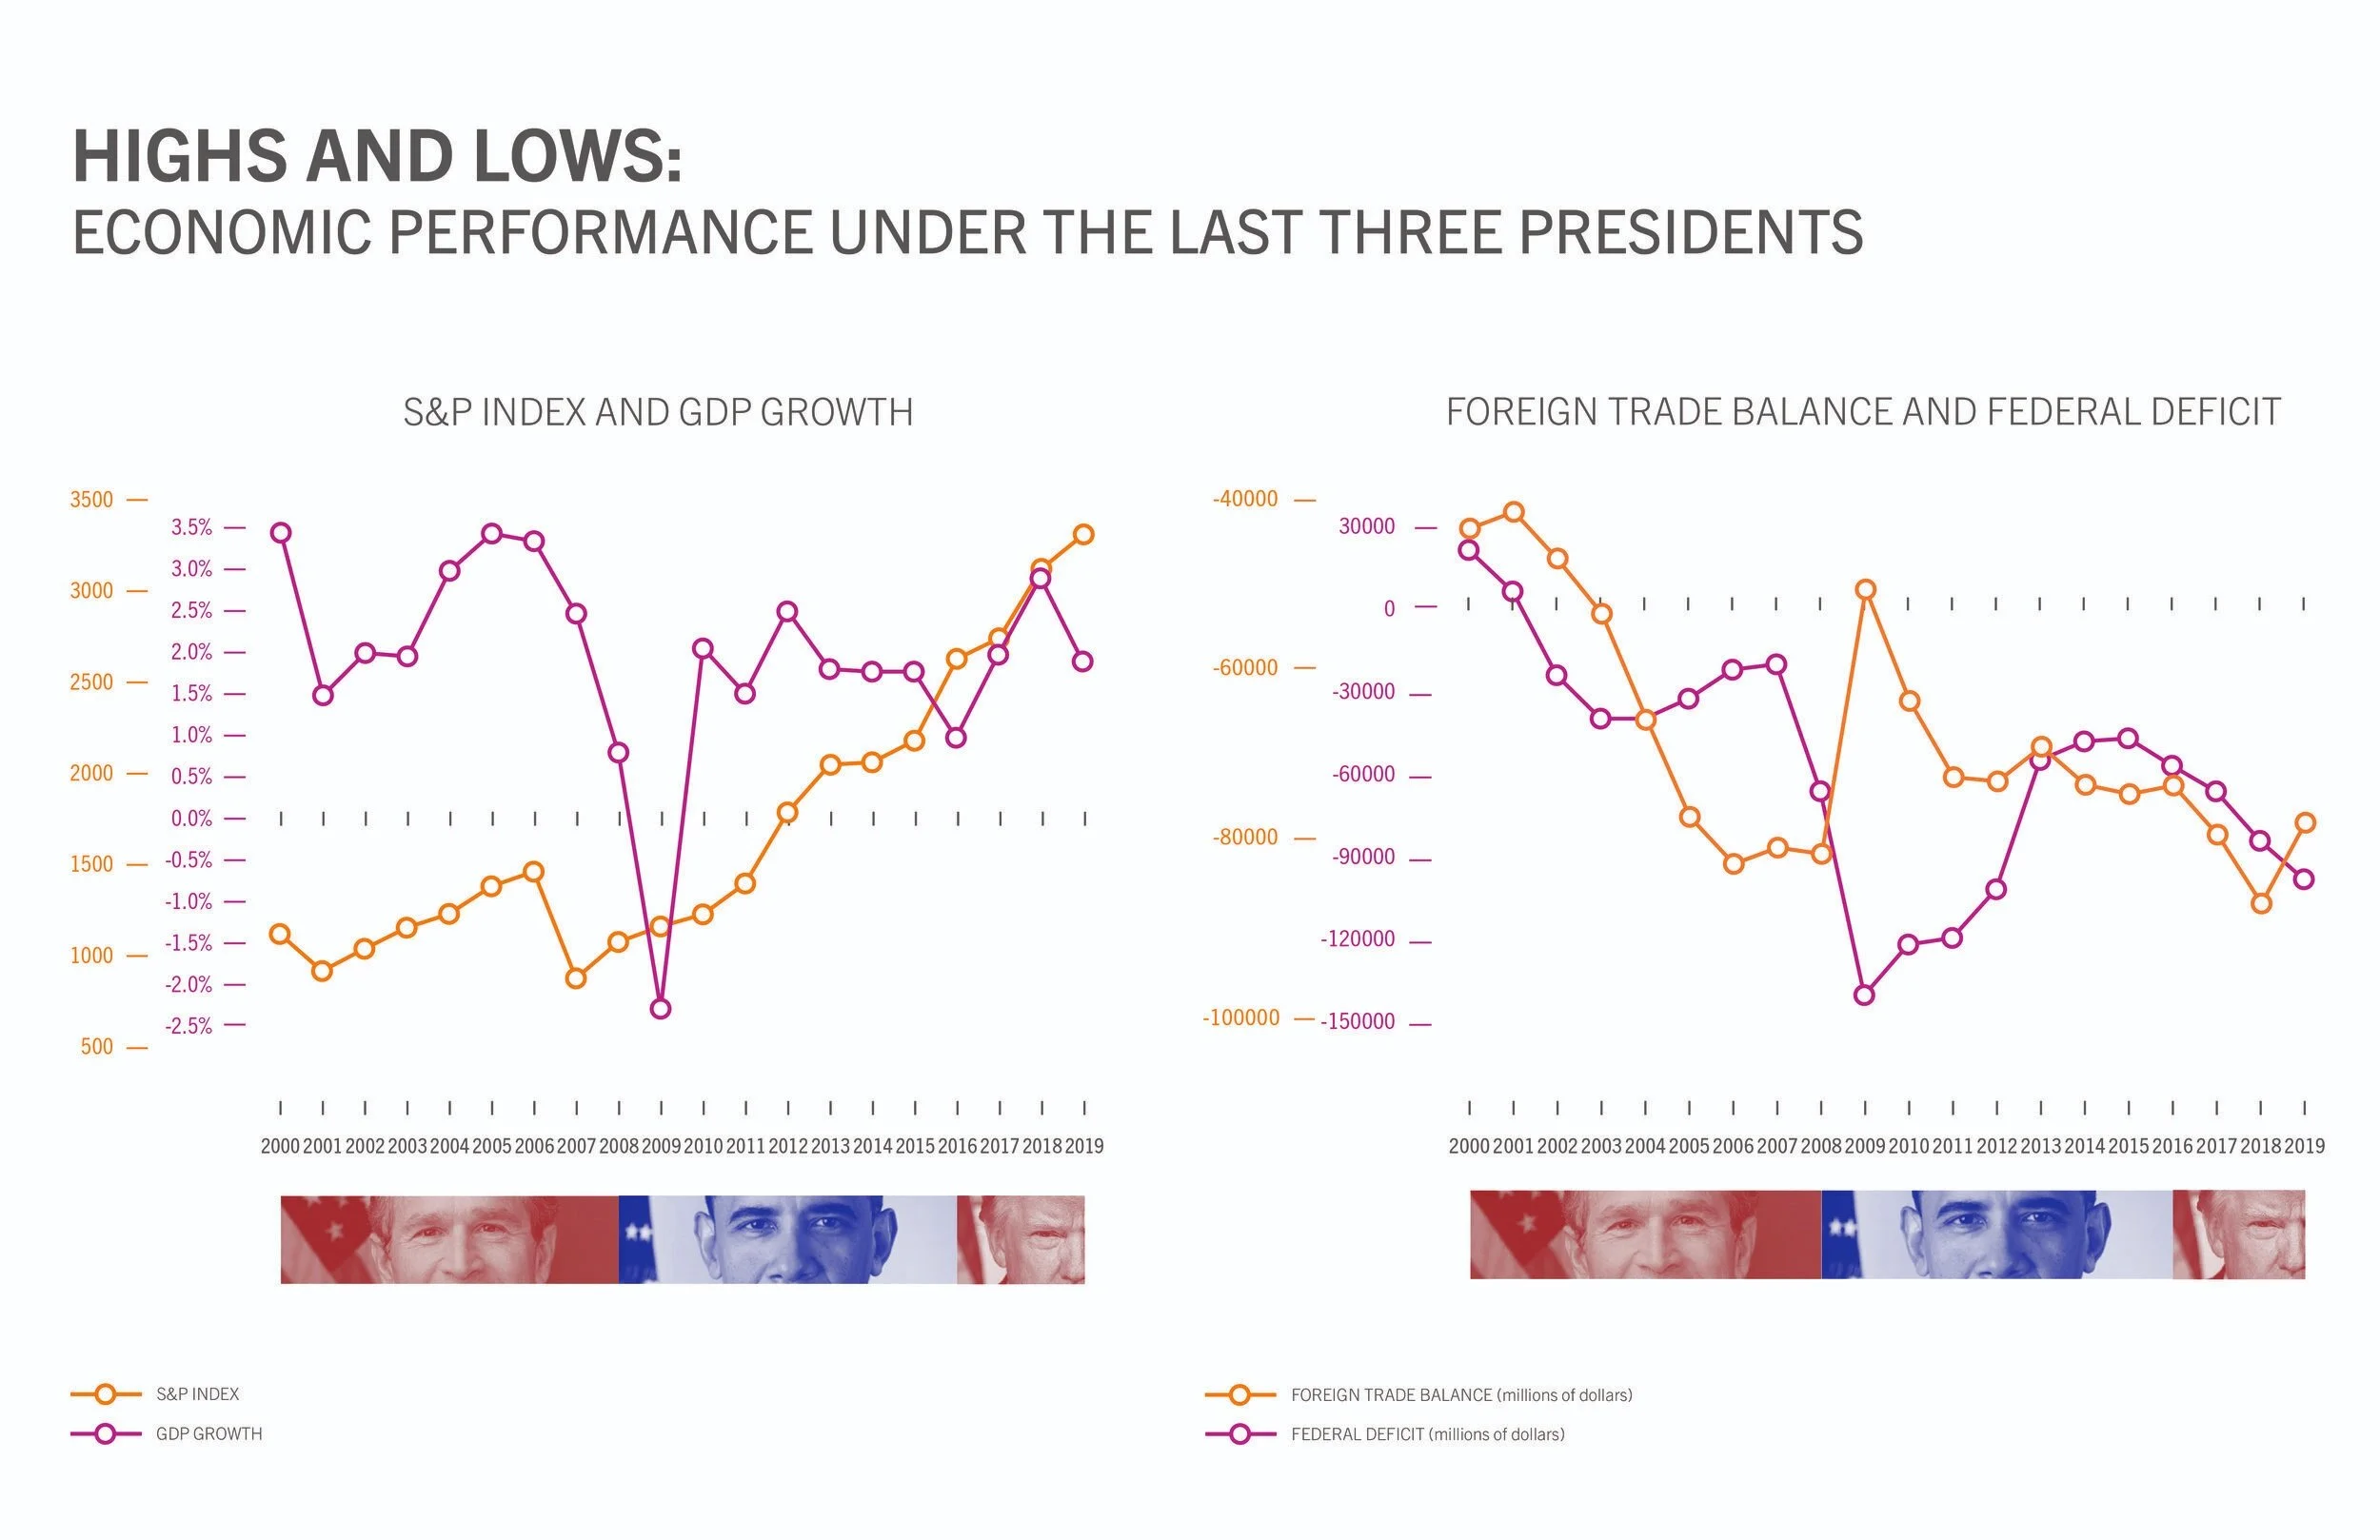
These graphs show the trends in the economy from 2000-2019 in terms of the S&P Index, GDP Growth, Foreign Trade Balance, and the Federal Deficit under the current and previous two presidents. The purpose is to inform about the health of the economy because voters tend to vote for presidents if the economy is thriving. Tracking the progress of the economy for the previous two and the current president helps to identify that the economy is its own entity, and policies are formed because of the economy. Economy Graph was designed and developed by Ria Parikh.